by Ben Discoe, published in Geo:connexion International magazine, May 2005. This article was online at http://www.geoconnexion.com/magazine/article.asp?ID=2212 until mid-2006, when the magazine reorganized their site and lost their links to older articles. This is an HTML copy of the original article.
Interactive visualization of geospatial data is becoming more mainstream. For many years, visualization occurred only in very small niches, isolated research projects, or in rudimentary form in the disparate fields of CAD, GIS, Vis-sim, and remote sensing. These fields are now moving toward each other, recognizing their overlap and converging in dramatic and interesting ways. For the past five years, the Virtual Terrain Project (VTP) has been tracking and aiding this convergence with a website, a mailing list and a suite of free, cross-platform open-source software.
History
VR did not become a successful industry for many reasons. Among them was the lack of compelling content in the virtual world and the difficulty of creating worlds that people cared about. The VTP was founded on the realization that at least one 3D dataset – the real world – is guaranteed to be of interest and use to people. With this understanding the VTP began with the intent to stimulate the broader adoption of 3D and thereby, fulfill part of the promise of VR. The project has grown as this goal has been pursued, becoming highly multidisciplinary.
Visual simulation (vis-sim) is the term used by the defense and aerospace industries and refers to the process of creating 3D interactive scenes, generally used in simulation of aircraft or ground vehicles. As this field has matured, demands for increased accuracy have grown. Subsequently, it has found itself in technical areas historically handled by the GIS profession. As computer aided design (CAD) users, who often work on limited land areas for architecture or civil engineering move toward greater realism and wider scope, they similarly find themselves in GIS and vis-sim territory.
Remote sensing and photogrammetry, historically a vital but highly specialized niche, is proving of increasing use in all these fields, opening itself to wider public knowledge and application. Each field contributes a part to the wider visualization picture along with other technologies. It would seem the time is ripe for exciting synergies to arise.
Obstacles to Growth
However, there are significant obstacles impacting the growth and evolution of visualization. These include limited access to data, the cost of both the hardware and software, a lack of geospatial skills among the public at large, and lack of multi-disciplinary knowledge in the geospatial professions.
Since geospatial education is increasing along with awareness of the value of geospatial literacy, and hardware costs are spiraling downward, the single biggest obstacle that remains is the data itself. Each part of the world, and each level of government and industry, has its own struggle between those that would restrict information (sometimes with the best intentions) and those that would liberate it.
In the USA, the Federal government has a tradition of making public data public, under the logic that the public owns what it has paid to produce. In the regions of interest to readers of Geo:connexion, this is different. In the UK and Europe, various levels of government make access to data difficult, expensive and highly limited. Sometimes this is justified, as “cost recovery” though costs are determined in an autocratic fashion that reflects a lack of accountability. In Africa and the developing world, there are often problems surrounding the collection of data in the first place. In these places, one must generally fall back on free global datasets as a starting point, e.g., SRTM, LandSat ETM, VMAP0, and try to extend these as much as possible with local knowledge.
Once a user has leapt these political and logistical hurdles, regardless of where he or she is in the world, they then face a similar challenge: how can I go from a pile of raw data – elevation, points and vectors, satellite and aerial imagery, thematic layers – to a visualization of my area that looks like the real place?
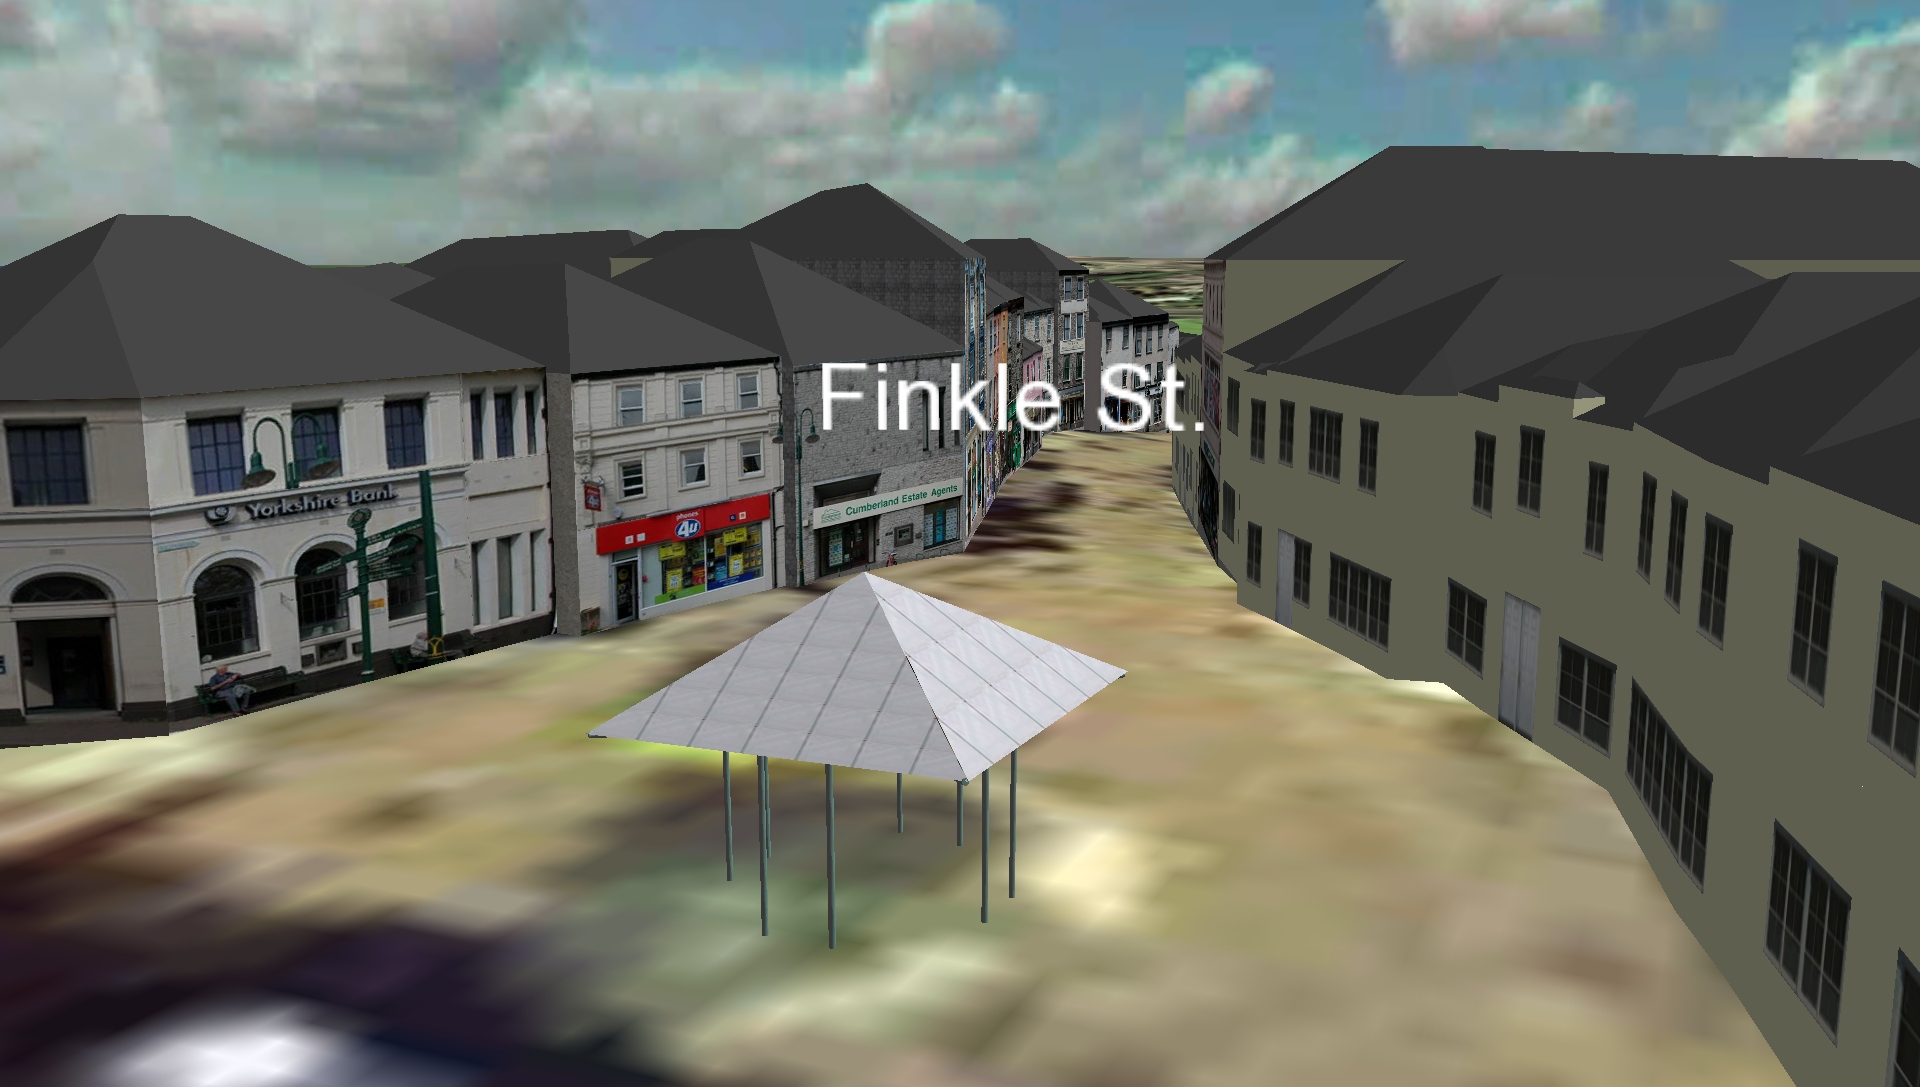 ABOVE: City planning application, Kendal, Lake District UK (c) Roger James, Virtual Outlooks Ltd. |
The VTP Software
The purpose of the VTP software is to enable exactly this process. There are two primary applications for the 2.5D and 3D stages: VTBuilder and Enviro. VTBuilder is a GIS-like tool for importing geodata from a very large set of file formats, and processing it in preparation for visualization. Enviro is a 3D runtime environment, taking the processed data and giving the user an experience that is interactive both in terms of viewing and manipulating the scene. The VTP also has tools for miscellaneous tasks including organization of 3D model content.
These applications make it easy enough for an end-user to produce a useful visualization. Since the since full source code is available, they are also a wide-open starting point for a developer to create a customized 3D environment with domain-specific uses. The license for the software is completely open, allowing and even encouraging people to take parts of the VTP software for their own needs, adding their own value and even reselling it.
These applications are built on top of a set of open application program interfaces (API). Over the past few years, the VTP APIs have integrated and built on other open APIs dedicated to specific fields, including the Geospatial Data Abstraction Library (GDAL) for geospatial processing and the OpenSceneGraph (OSG) for 3D rendering. Many of these libraries have matured and evolved to the point where they meet or exceed the capabilities of proprietary closed software.
Value of Openness
The many advantages of open-source software are fully applicable to the geospatial domain. Open software, when it is useful, creates a community of users which quickly finds problems and pools effort in solving them. This community provides a first level of free support and ensures that software will not be abandoned and lost, as is often the case with closed software when a contract ends or a company goes out of business. Open source, in particular the very open license the VTP uses, means that everyone has a kind of ownership and freedom in how they can use and extend the software to meet their needs. Open source does not mean non-commercial, as there is still substantial commercial potential in the real value of a software provider – extended support, training, and custom development, even up to the point of packaging and re-licensing.
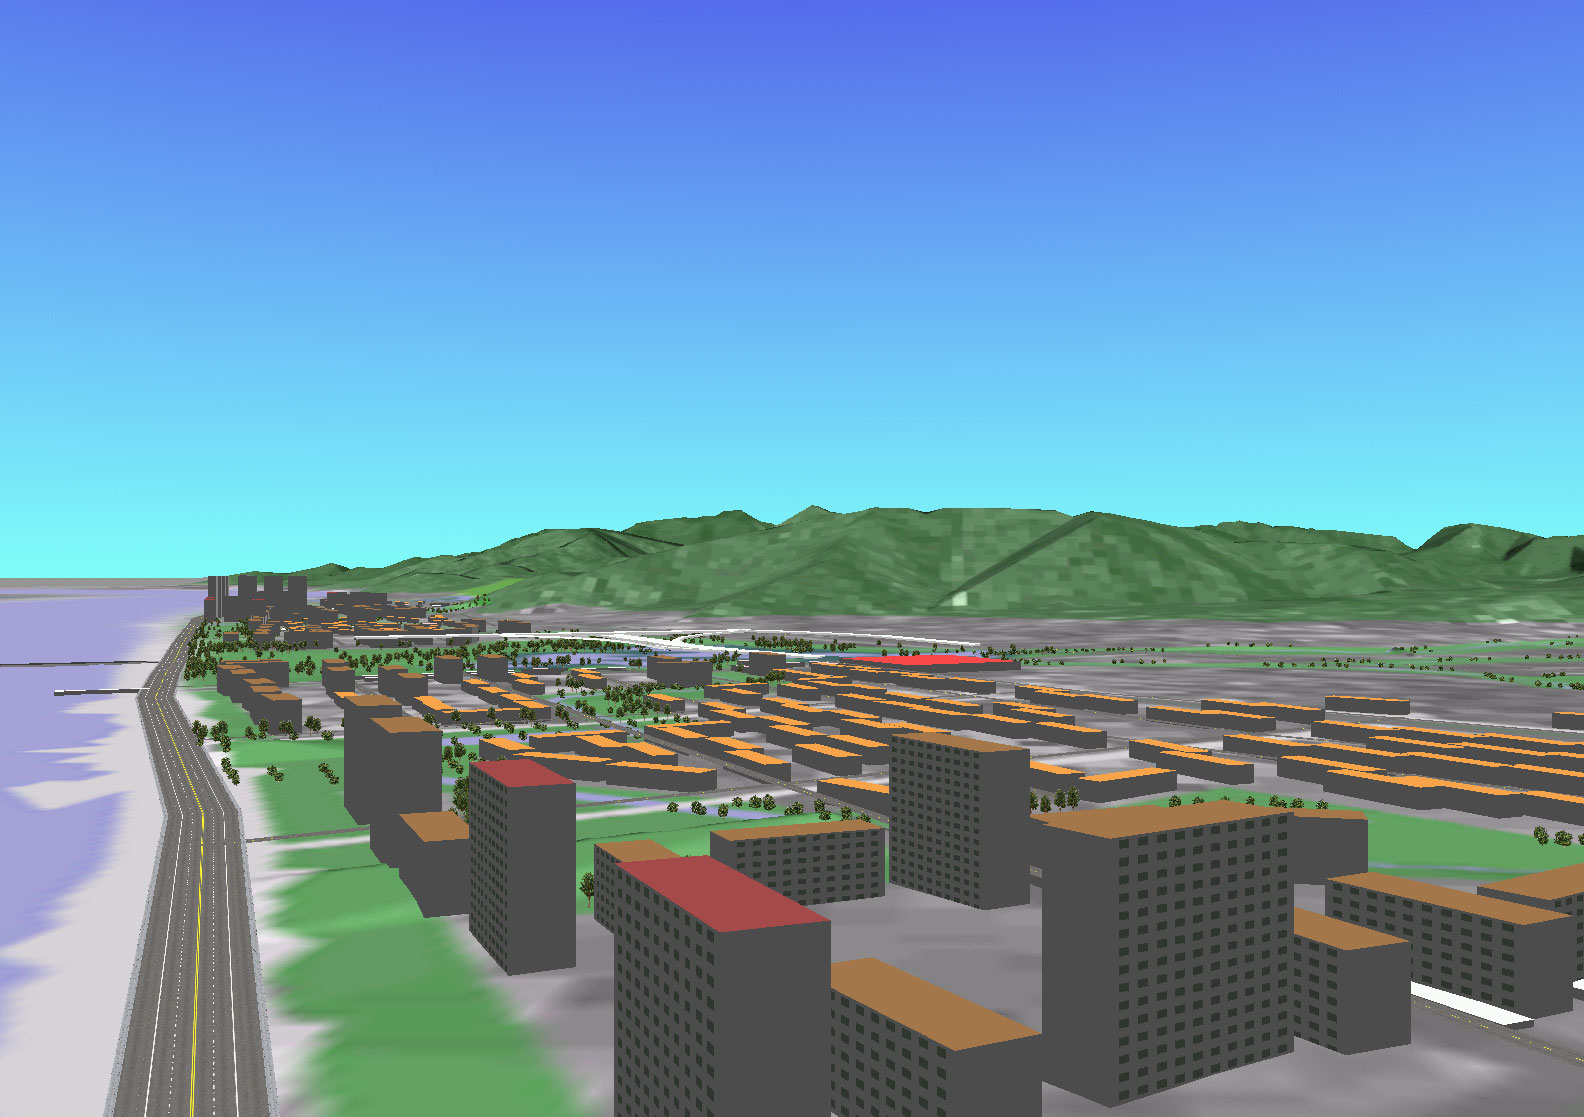 ABOVE: City of Hangzhou (Courtesy of Dr. Michael Flaxman, Harvard GSD) |
Working with VTP
The usual process of using the VTP software is as follows. “Raw” data is located online from public sources or licensed from commercial sources. It is brought into VTBuilder, where it is reprojected and aligned as needed. Higher-level knowledge is added, such as turning footprint polygons into attributed buildings, raw vectors into fences, or vegetation coverage areas into a forest of tree instances. These data are then organized on disk and read by Enviro, which loads them, turns them into 3D geometry, and gives the user a host of capabilities from navigation and waypoints to editing the scene, such as planting trees and moving buildings.
Traditional 3D models from CAD or tools such as 3D Studio MAX can be imported and placed either manually at runtime, or in a data-driven process beforehand. Imagery from any source is draped on the ground, large heightfields are handled efficiently via Continuous Level of Detail (CLOD) rendering and sky conditions imported as photographs. Sun location and shadows are computed with precise algorithms and vegetation drawn with either photographic billboard or 3D plant geometry, and so forth for every visible aspect of the world. Beyond the visible, abstract data such as boundaries and city names can be read from traditional GIS formats and drawn simply as lines or text in 3D.
Besides supporting the active and legacy file formats of all the converging domains, the VTP has occasionally had to invent new file formats. For example, when in 1998 there was no compact binary format for interchange of elevation data, the BT format was created. The lack of an efficient standard for biologically-informed vegetation placement gave rise to the VF format. For parametrically defined buildings and other human-built structures, the VTST format was initiated.
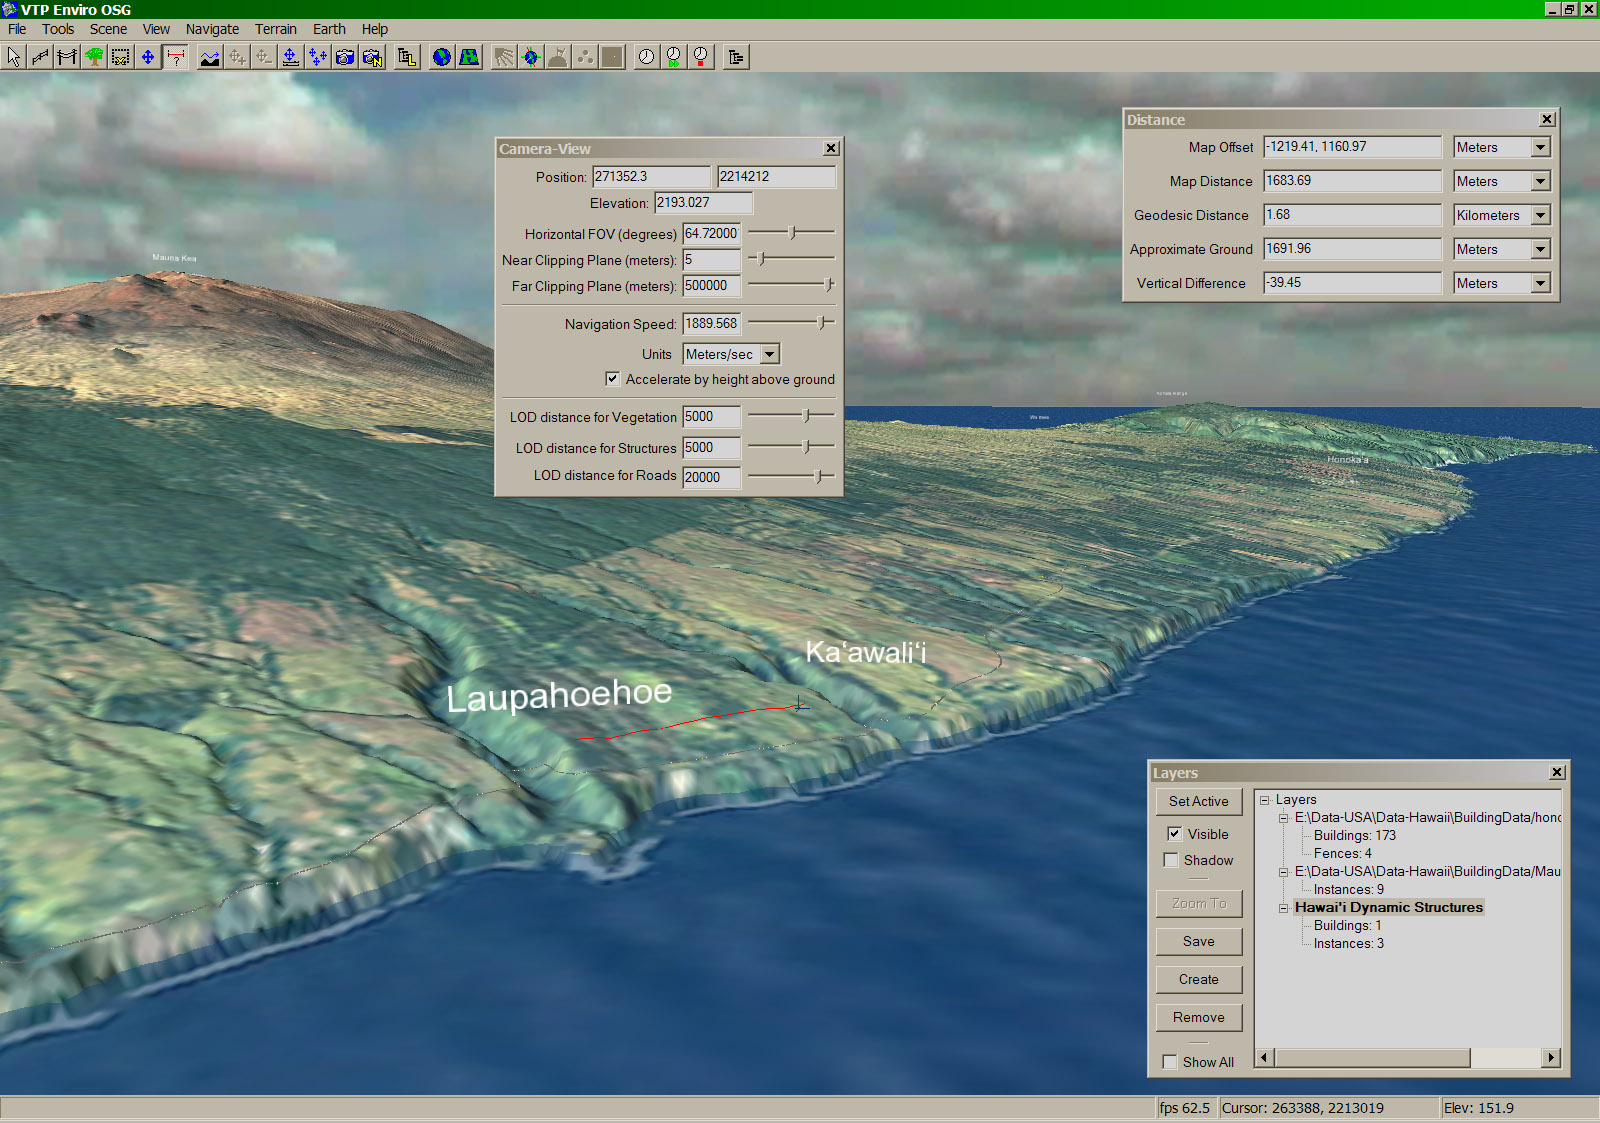 ABOVE: The Big Island of Hawai'i |
Examples of the VTP Software in Use
One simple but easily accessed demonstration of the VTP software is included with the software download: the Island of Hawai‘i, a scene which is useful for travel planning to scientific visualization. It is intended as a prototype of “virtual tourism”. Producing the scene was made easy by the availability of USGS data. Unfortunately, in nearly any other part of the world, the data will be harder to find, and the uses often tightly restricted by license requirements.
Often, good applications result from cooperation between many entities including those that control the data. An example of this was a study done on the city of Hangzhou, China, by members of the Harvard Graduate School of Design. Hangzhou faced a crisis due to rapid growth which threatened to overwhelm its scenic, historic West Lake area. The study used satellite imagery, local GIS data, 3D modeling software, and a range of GIS software together with the VTP for visualization of several planning scenarios, which were then shown to decision makers in interactive sessions. Planners were able to directly observe the effects of options such as leaving green open-space areas in a new city center, with clear advantages over the 2D colored maps of traditional urban planning.
Urban, regional and transportation planning are perhaps the most visible and active areas in which the VTP is being put to use, with planning users in Sweden, Melbourne Australia, and the Lake District in the UK. Besides planning, components of the VTP are seeing active use via integration into commercial software in the fields of earthwork estimating and transmission line engineering.
In the academic context, the VTP has enabled and provided a starting point for many graduate research projects in universities around the world, from hurricane simulation in Florida to geography studies in Romania and Pakistan, as well as for use in government/academic projects like VisuLands.
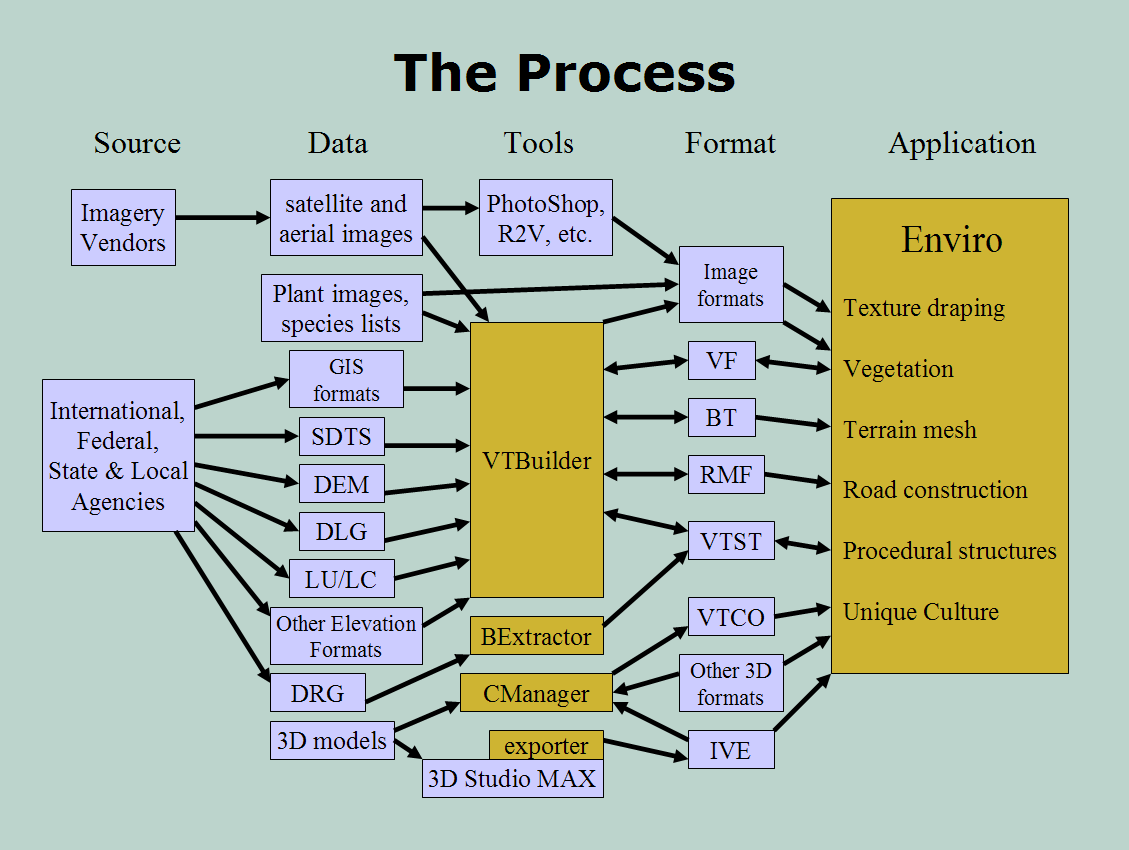 ABOVE: Simplified view of processing raw data with the VTP into a finished visualization. |
Proprietary Software and Synergy
The conventional (closed) software world has certainly not stood still. ESRI notably has recently added capabilities with ArcGIS 3D Analyst and ArcGlobe, which match or exceed most capabilities of the VTP, albeit at a price, both in terms of cost and openness. Autodesk has also ventured into this exciting convergence space with Autodesk Map® 3D. Landscape rendering tools such as those from 3D Nature have taken on GIS capabilities and become much more powerful, as with their VNS (Visual Nature Studio) package. There is even software from the videogame industry that is moving into this space, with labels such as ‘serious games’ used to describe applying the traditional strengths of low-end 3D engines to the task of real-world visualization.
Fortunately, it is often not a matter of having to choose between an open and closed solution, since many formats and standards are open enough to allow for interoperability. As an example, it is possible to take raw SRTM tiles into VTP’s VTBuilder where they are stitched and merged with gaps interpolated, sent to ArcGIS where the elevation is analyzed and polygonal themes are rasterized to produce synthetic ground imagery, sent to VNS where roadways and building plots are flattened via Terraffectors, then the output sent to VTP’s Enviro for an interactive runtime.
Summary
Open-source tools with low barriers to entry like the VTP software act as catalysts for new uses and wider adoption of geospatial visualization. The VTP is an educational resource helping to grow the pool of people with geospatial skills outside a single field, a leg up for many students and professionals around the world who may lack the funds or access to large commercial software tools, and an open platform for developers to create applications for 3D geodata’s growing number of markets and niches. It’s an exciting time for visualization!
Additional Information Sources:
The VTP: http://vterrain.org/
The Hangzhou Study: http://www.gsd.harvard.edu/users/gsd98mf2/research/vtp_china/
VisuLands: http://lrg.ethz.ch/visulands/fs_visulands.html
GDAL: http://www.gdal.org/
OSG: http://www.openscenegraph.org/
3D Nature: http://www.3dnature.com/