Ben's Home Terrain |
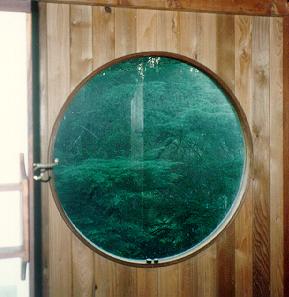
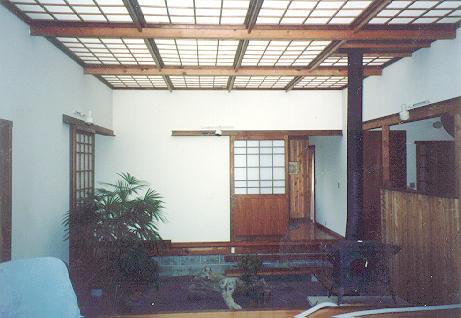
I have always wanted to model the place I am from, a small farm in Ahualoa, even years before I began the VTP. I'd like to give a virtual tour of my land - from the native trees along the driveway to the shoji drop-ceiling that casts a soft light into the center of the house. I'd like to pan back and see the farm in the context of the larger community. But, it's a poorly-mapped part of the USA with poor data availability, so it's challenging.
You can see it in google maps, but it is blurry and inaccurate. In google earth, the 3D is also uselessly wrong. USGS data is no help.
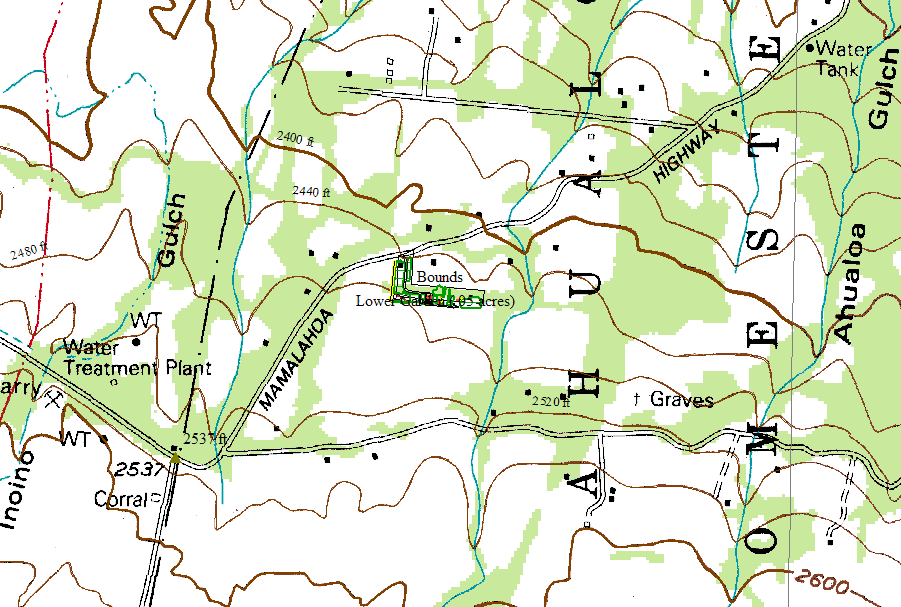
From looking the USGS topo DRGs, it looks like the house is at (UTM zone 5 NAD83: 237620, 2219325), which is lat-lon 20°03'11" N, 155°30'30" W (that's 20.0532,-155.5084). We can guess that elevation is around 750 meters because there are two contour lines passing near the property: the 2480' (755.9m) line at the southwest corner by the pond, and the 2440' (743.7m) line at the base of the driveway:
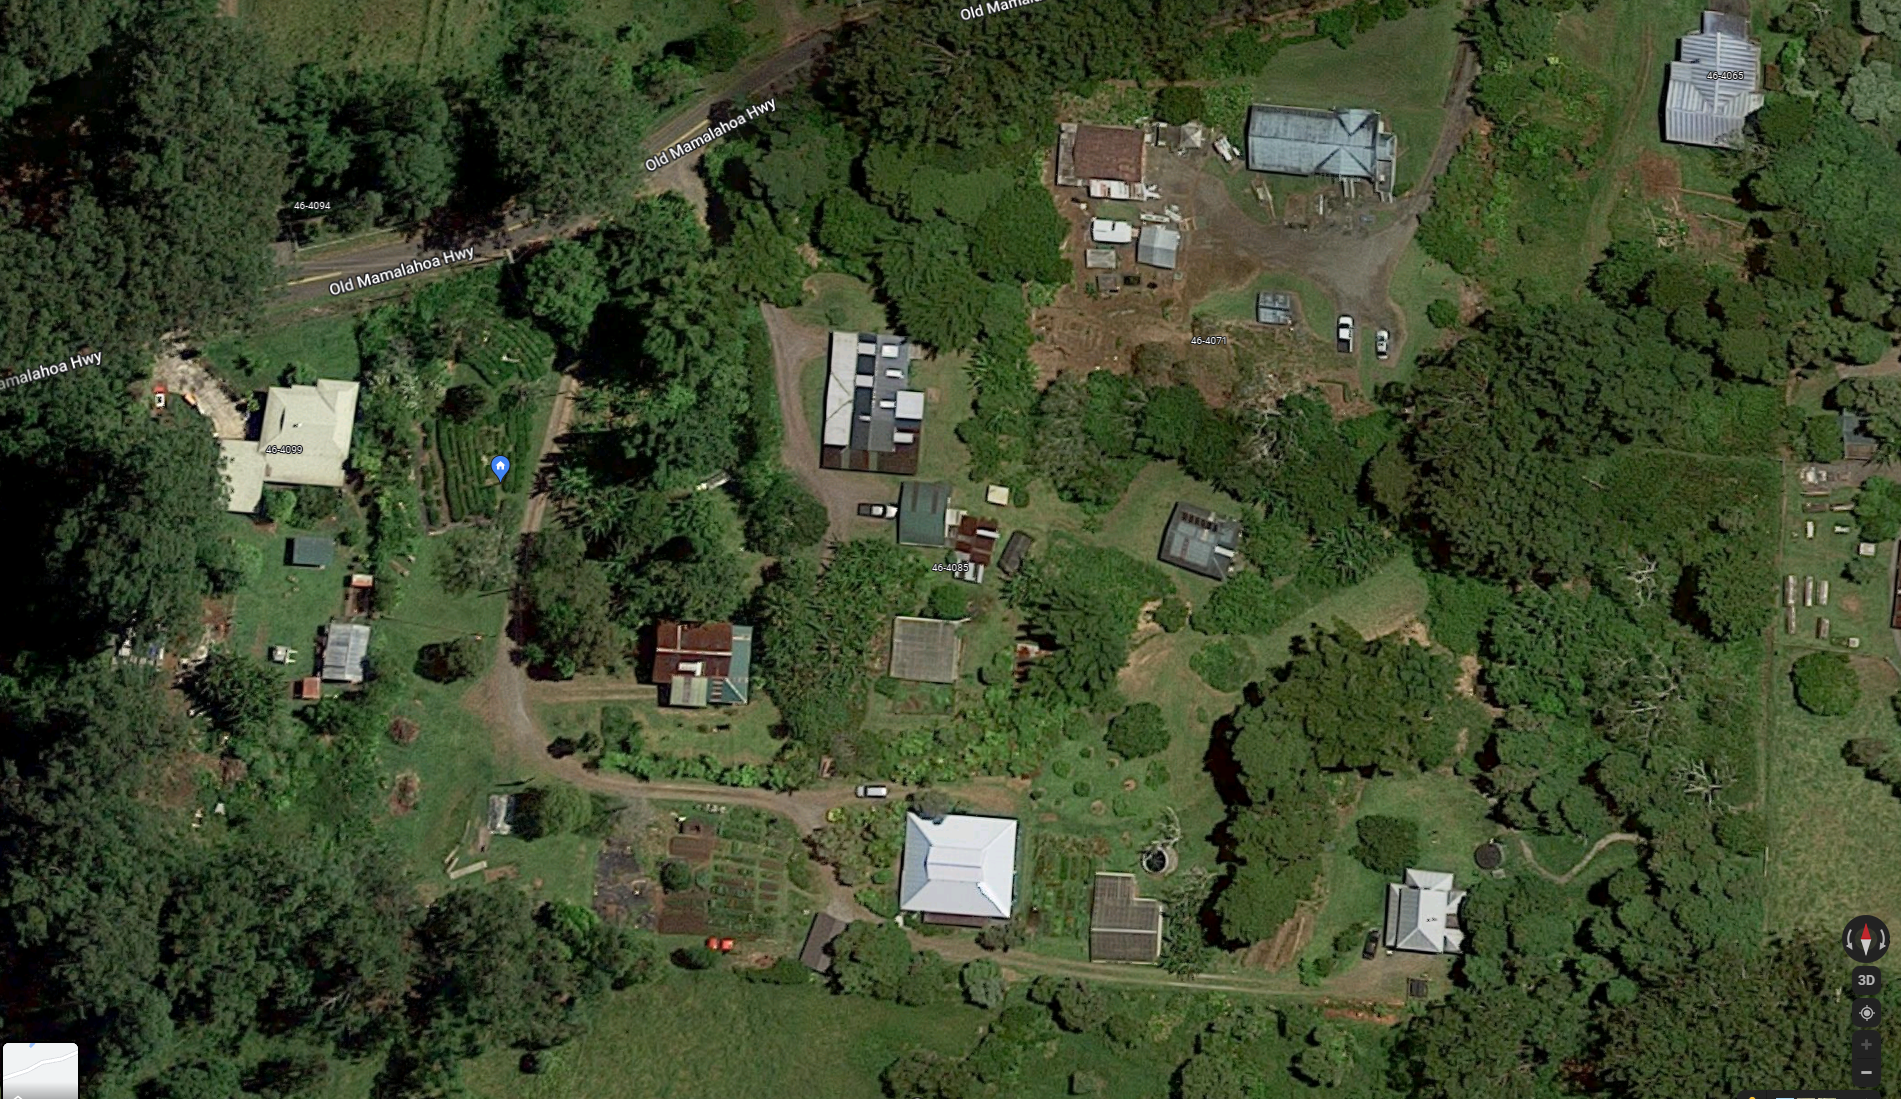
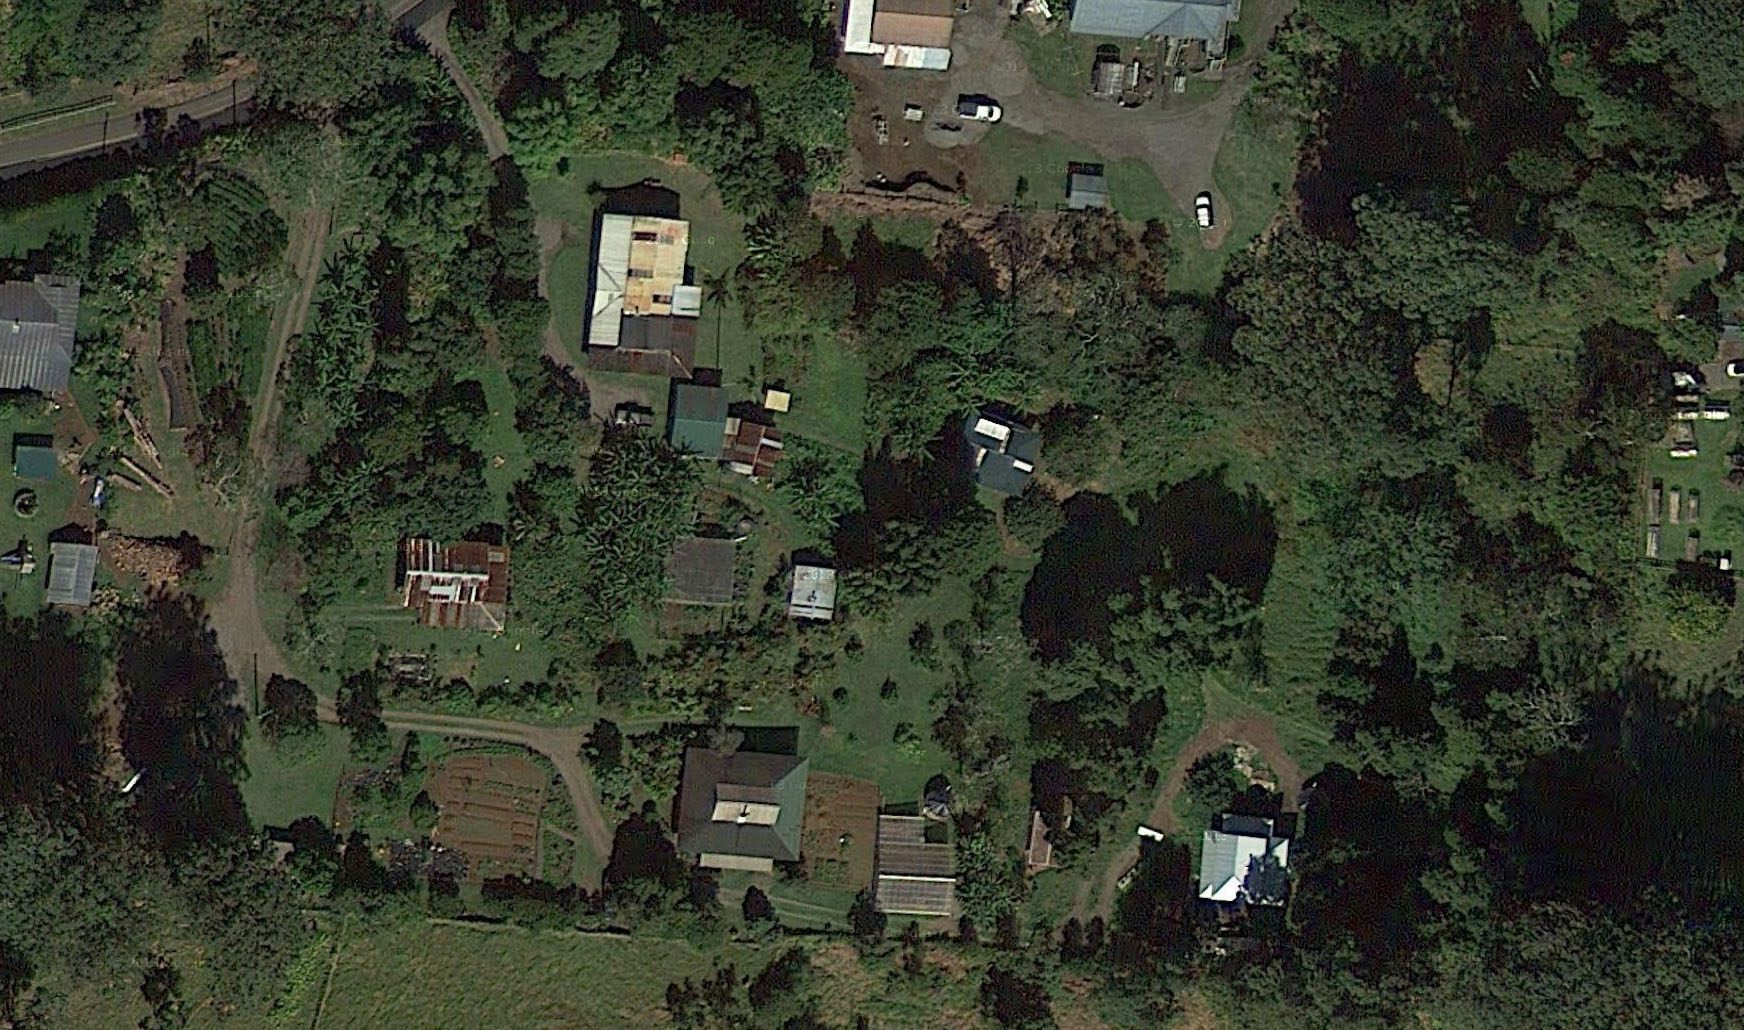
GoogleMap's image taken early 2019 is the best known available imagery, from any source. Of course, it is not free to use, and it is several years out of date.
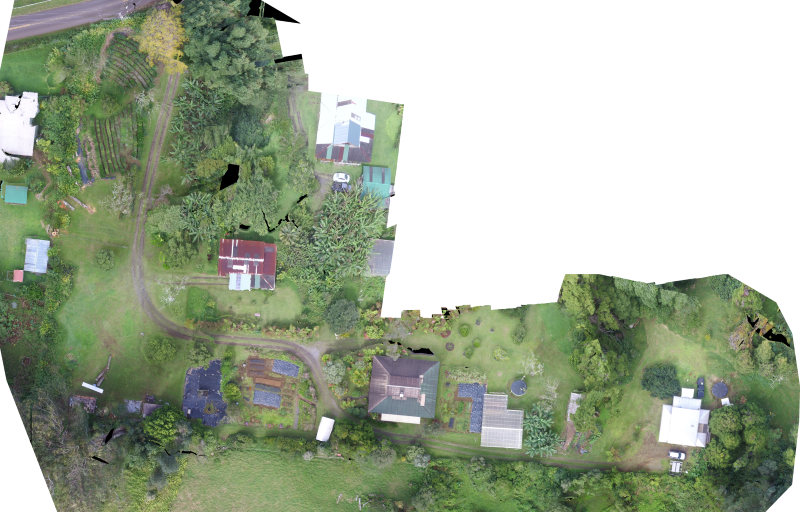
I also attempted to make an orthophoto in 2017. I used the "dronemapper" mobile app to flight-plan and control my DJI Phantom3, gathered 88 images at roughly 3 cm ground resolution. The images were processed into an orthophoto using dronemapper's software-as-service, and also processed using Pix4D's similar service. Below is a snapshot of the ortho as processed by Pix4D. Dronemapper and Pix4D produced similar results for areas of flat ground, but gave very significant distortion/clipping artifacts around obstructions like trees, and curiously, they gave very different artifacts from each other (diferent algorithms). Also, as of 2018, both cost around $1000/year subscription to use the software-as-service, so that puts a damper on the future.
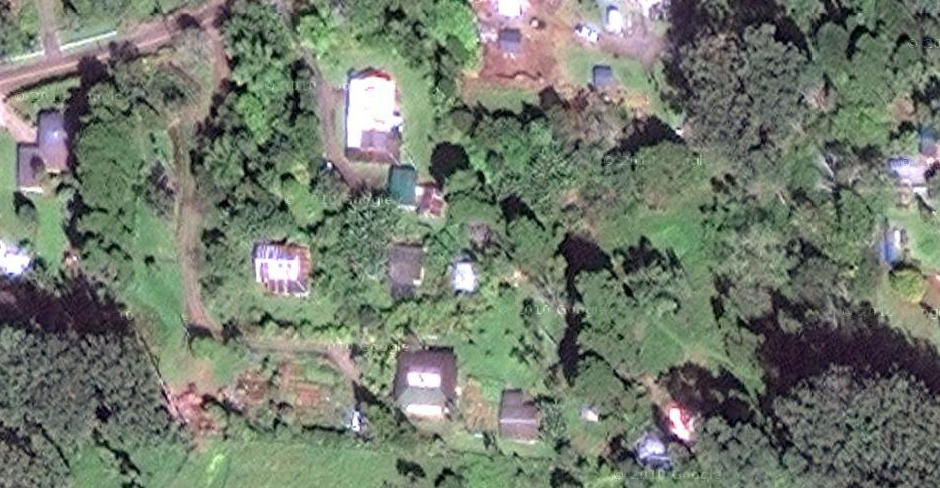
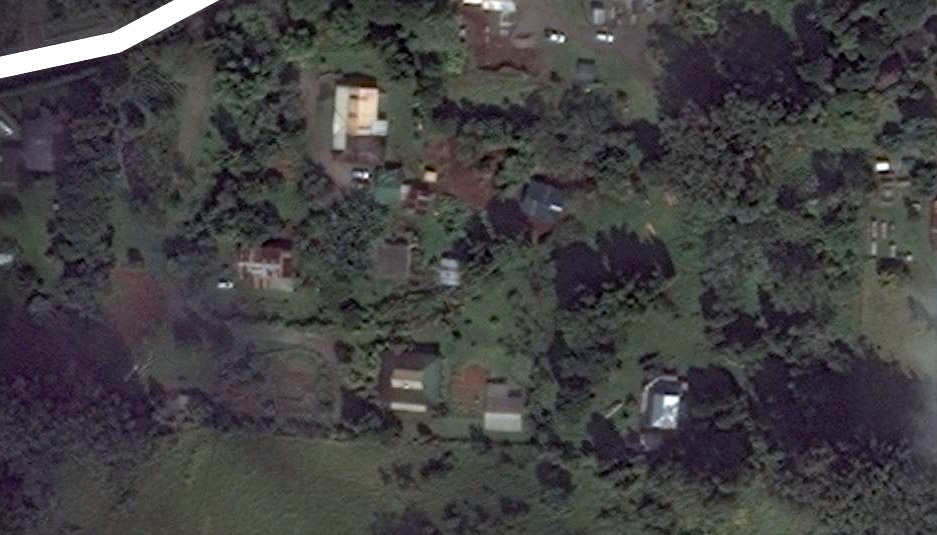
Previously, Google's image taken January 2013 was the best known available.
In it, the known marker spot is at -155.508606, 20.053247.
The 2013 image, shown here reduced by 50%, click for full image:
It is at their "zoom level 20" resolution. Real-world resolution is difficult to judge in Google's "spherical mercator" CRS, so to estimate resolution, i compare the size of a known identifiable feature (the east-west edge of the main building roof) which is 17 meters. In the image, it is 122 pixels, hence, 14 cm/pixel resolution.
In Google's previous DigitalGlobe imagery from December 2009, the known point
is at -155.508362, 20.053239.
2009 is nominally around 30 cm/pixel ("zoom level 19"), but image quality is poor:
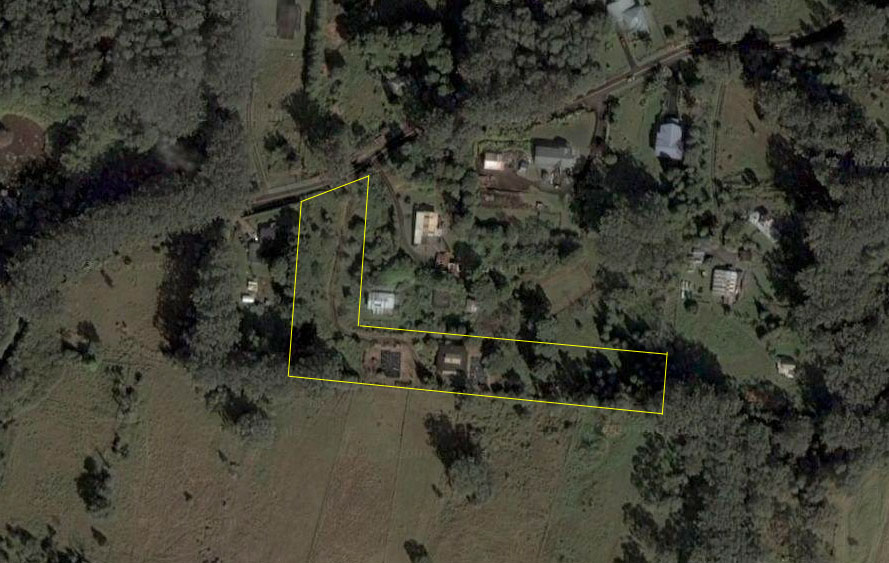
2003's DigitalGlobe imagery (nominally around 60 cm/pixel resolution, "zoom level 18") was shifted around 8 meters off from the 2009 image. This is the 2003 image with a very approximate property boundary hand-drawn on:
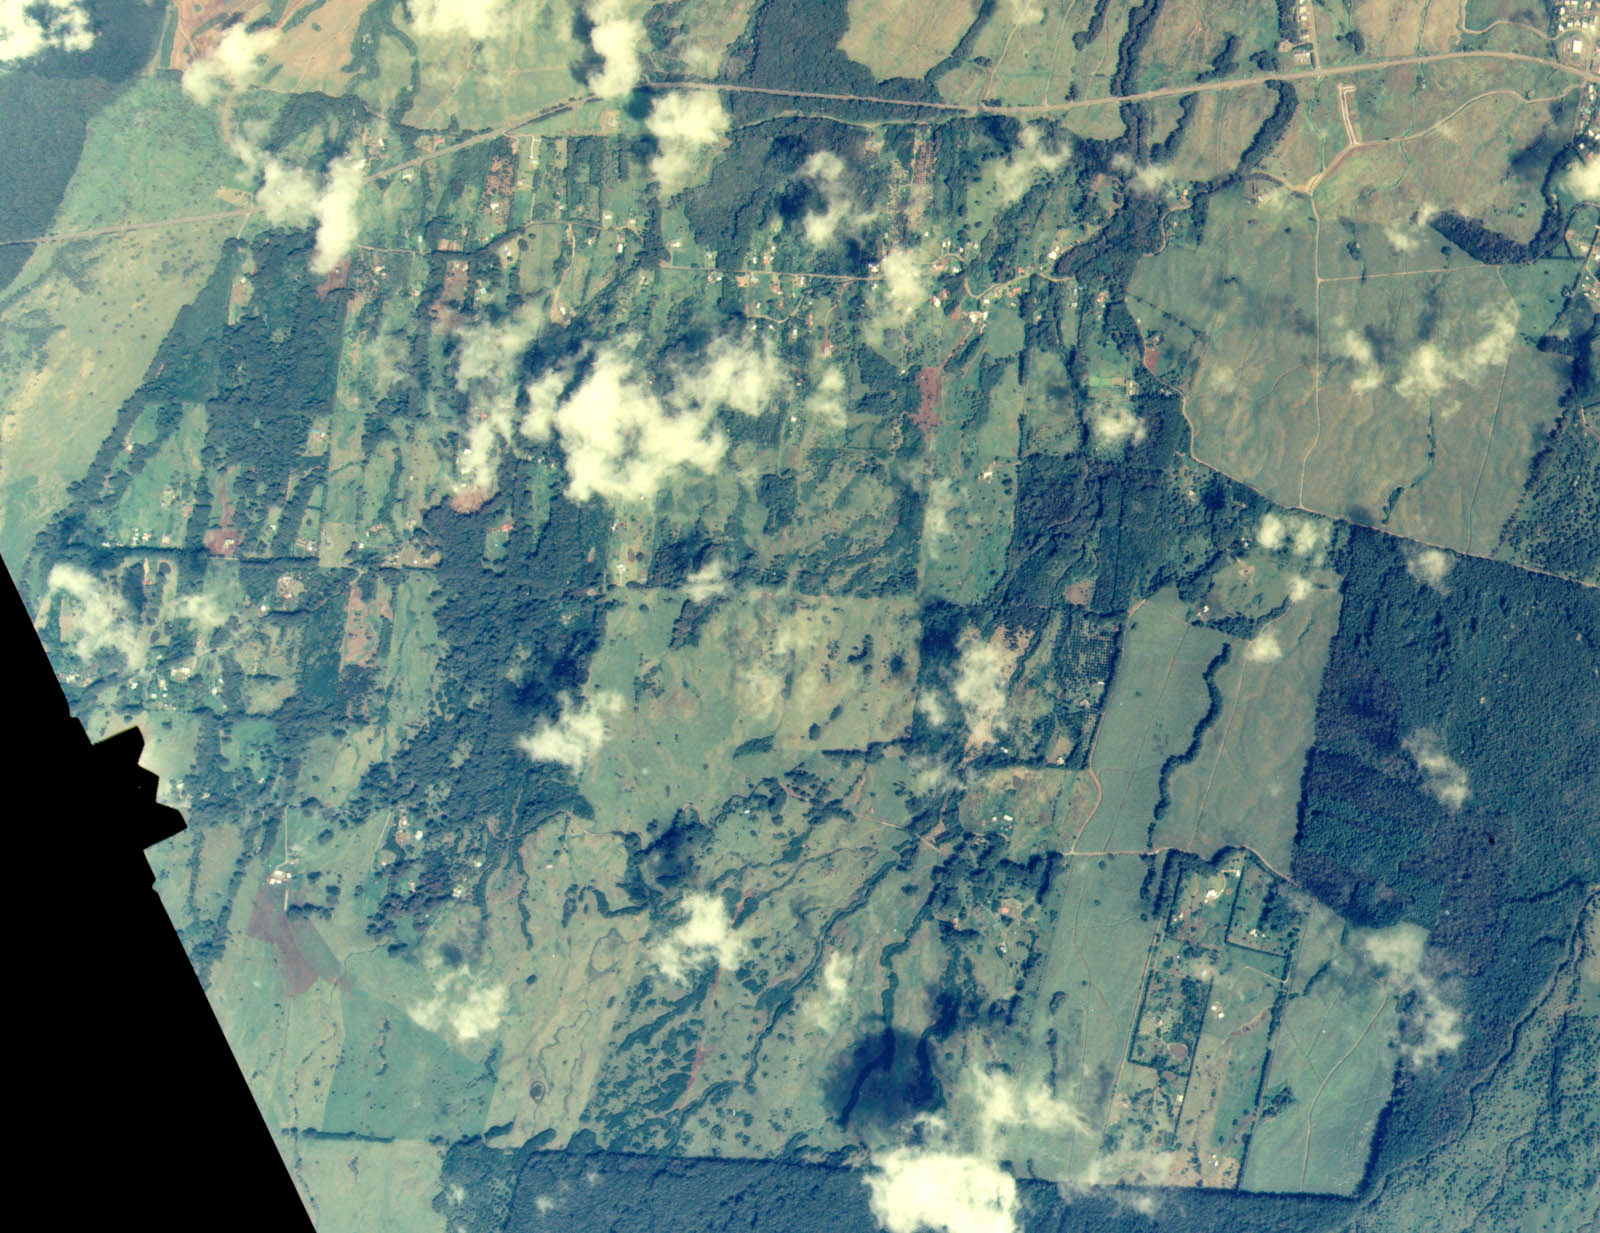
Microsoft Bing, in 2012, released imagery which as has poor color quality, and blurred by cloud shadows, but nominal resolution 30cm:
As far as I know, all the Google and Bing imagery are from space. There is not a single georeferenced/georectified aerial available of this place, anywhere, for any price. There is an assortment of old, non-referenced aerials which i have gathered and digitized, but without ground control, they are not much use. Also, they were captured as 9" analog film prints from a high plane, so they do not even match the usable resolution of the space imagery. They look like this:
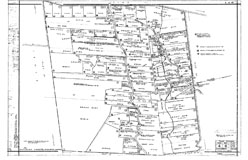
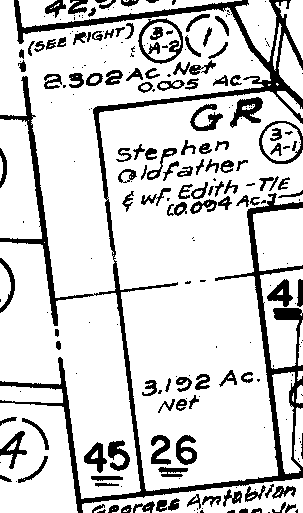 see
a description of tax maps
see
a description of tax mapsArea is 2.305 acres in a long L shape. USGS 10m DEM, because it is derived from those two DRG contours that barely approach the land, lacks sufficient detail to get even a rough idea of the elevation of the parcel. Manual surveying would be necessary to get elevation contours, but that's cost prohibitive.
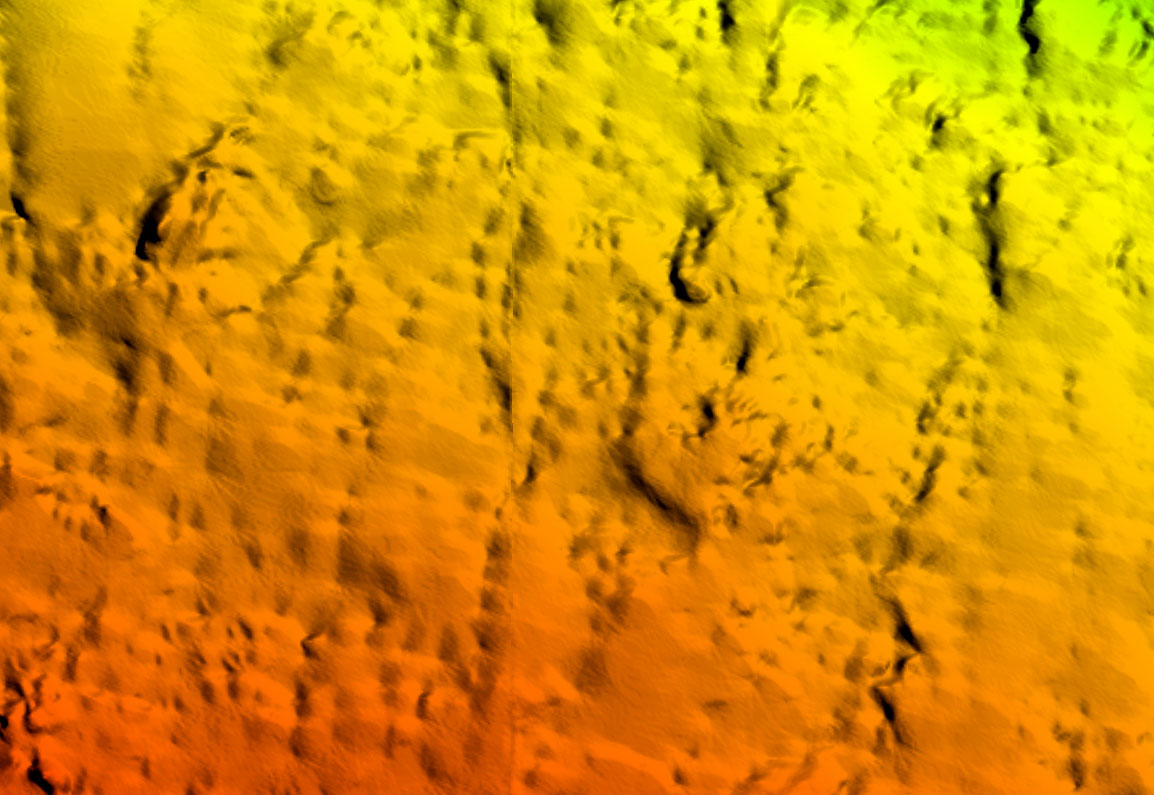 USGS DEM 10m |
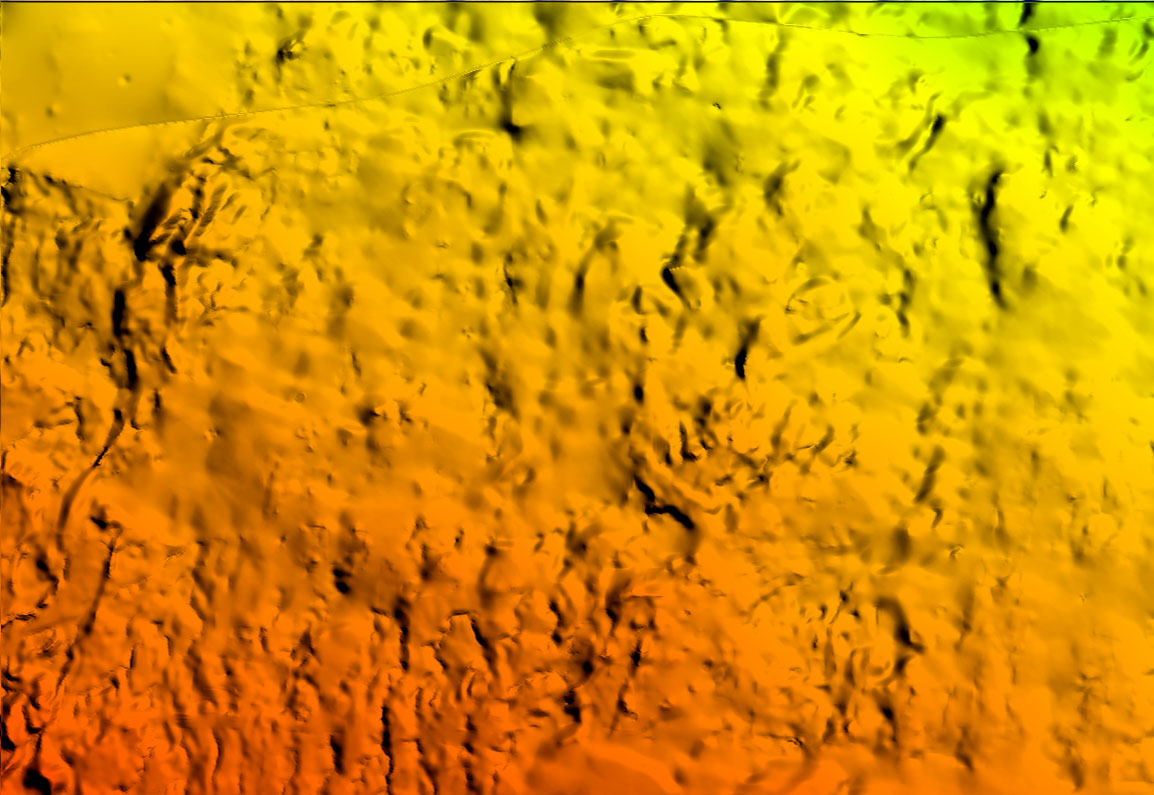 Intermap 5m |
 USGS DEM 10m |
 Intermap 5m |
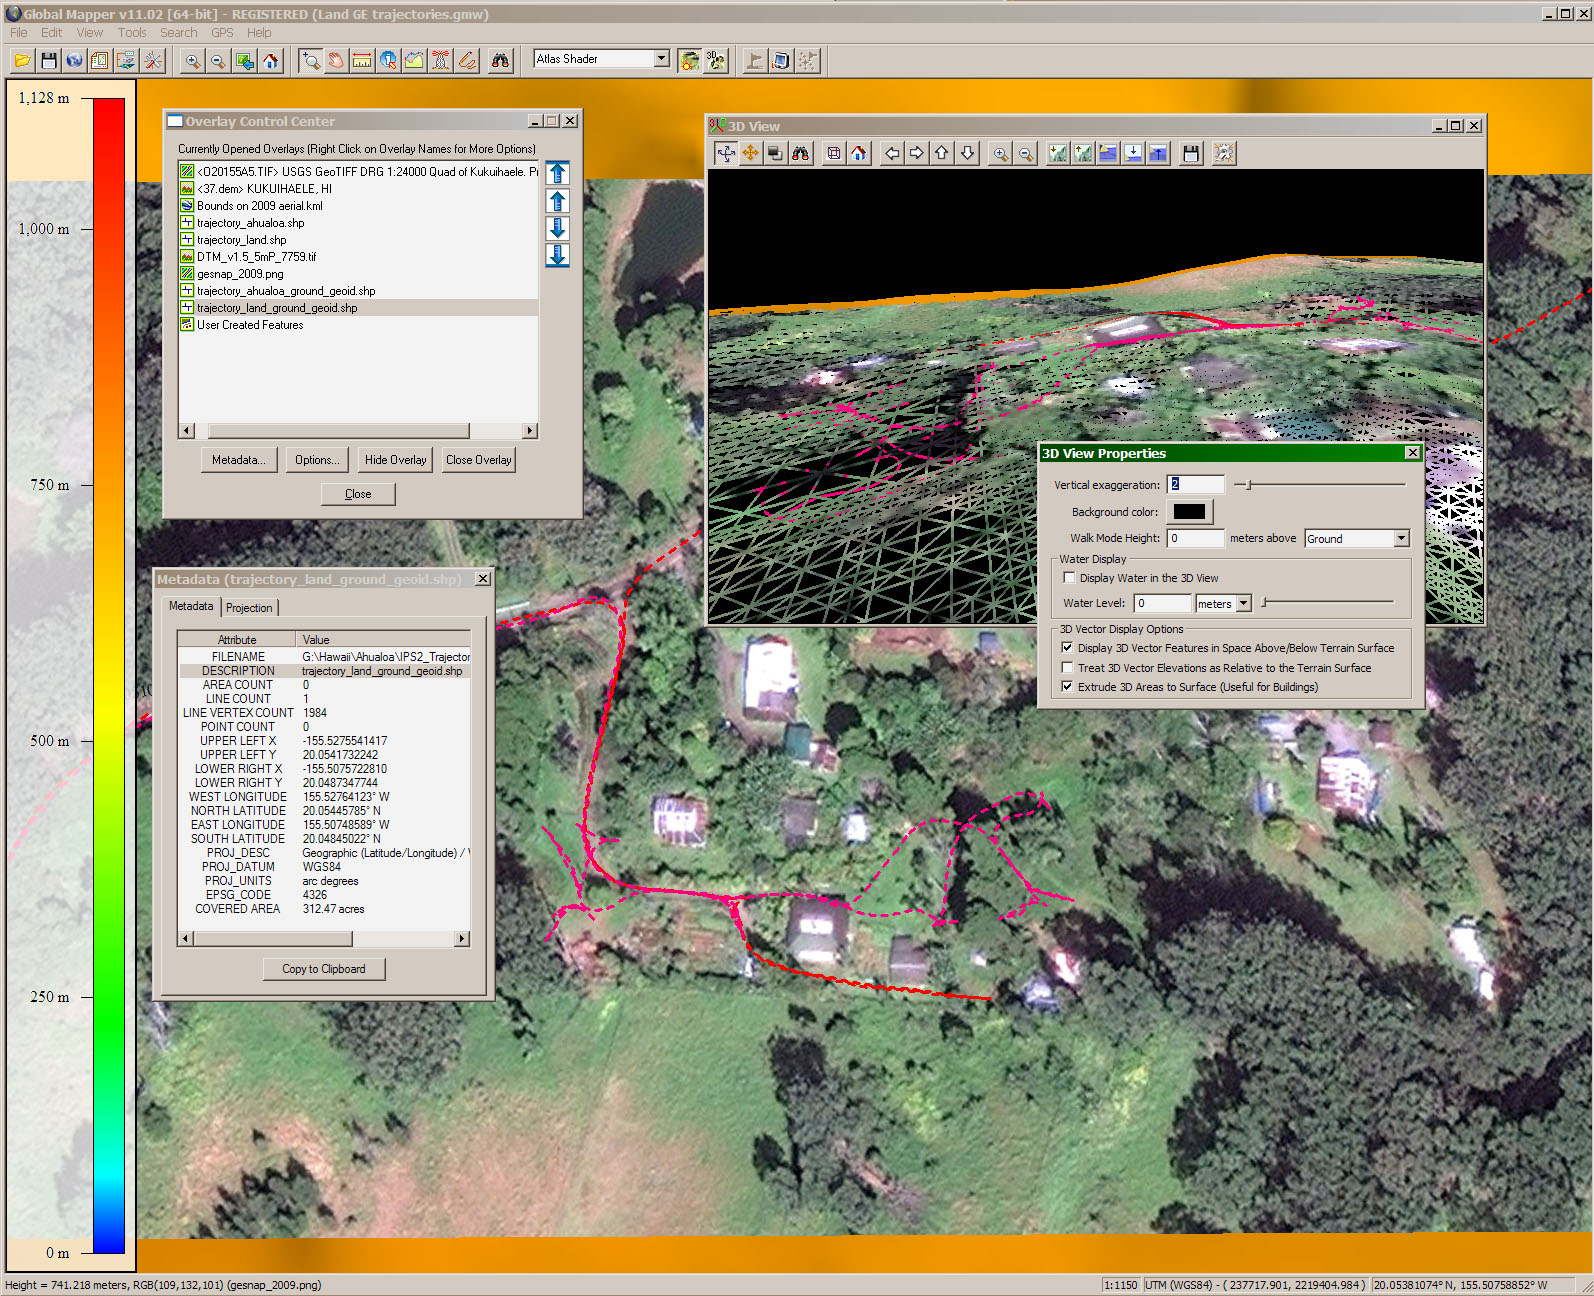
In February 2011, i used an IP-S2 system with 3 SICKs to laser-scan the land from the back of our Ford pickup truck. The data is only collected near where the truck could drive, which is only a fraction the land. The GPS trajectories are fairly accurate because of DGPS, IMU and extensive post-processing.
One base point: According to a very accurate (OPUS) point measured just in front of the upper garden gate:
 REF FRAME: NAD_83(PACP00)(EPOCH:2002.0000)       ITRF00
(EPOCH:2011.1024)

        X:     -5455176.415(m)
0.029(m)          -5455177.372(m)
0.029(m)

        Y:     -2485079.832(m)
0.022(m)          -2485077.310(m)
0.022(m)

        Z:      2173499.339(m)
0.029(m)           2173500.362(m)
0.029(m)

      LAT:   20  3 11.65139      0.033(m)        20  3
11.68458      0.033(m)

    E LON:  204 29 29.08736      0.010(m)
204 29 28.99474      0.010(m)

    W LON:  155 30 30.91264      0.010(m)
155 30 31.00526      0.010(m)

   EL HGT:          773.960(m)
0.030(m)
774.146(m)   0.030(m)

 ORTHO HGT:          752.566(m)
D.N.E. [No official datum supported (FAQs 19,20).]
As decimal degrees, in "NAD83", that is: -155.508586844, 20.0532364972
This "ortho hgt" value (orthometric) agrees very well with the USGS DEM:
Trajectory of truck IMU at a reference point on driveway: 773.4 m (vs. ellipsoid)
Height of truck IMU above ground: 2.1 m
Height of ground measured by GPS/IMU: 771.3 m (vs. ellipsoid)
Height of ground from LIDAR: 750.0 m (vs. geoid)
Difference (ellipsoid - geoid): 21.3 m
Difference (IMU - geoid): 23.4 m
Relative to that OPUS accurate point:
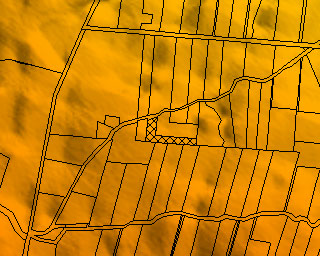
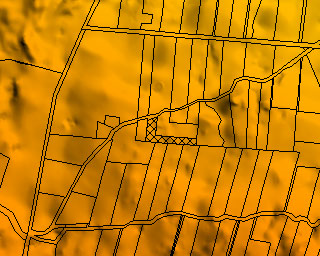
This image shows a number of things: The trajectories as colored 3D vectors, rendered in 2D and 3D in Global Mapper, with a scraped snapshot of Google Maps imagery draped over the 5m LIDAR grid. The innacuracy of the 5m is large enough that the trajectories go under the ground in many places, which is why the 3D view is in wireframe, so you can see underground:
With the IP-S2 system, we gathered point clouds for the farm, the neighborhood, and the nearby town of Honokaa. Two runs overlap on the farm, which gives a bit more coverage but also introduces registration issues: where the calibration/trajectories don't quite match, then neither do the clouds. Here is a snapshot of top-down ortho view, and an oblique view, of the point cloud:
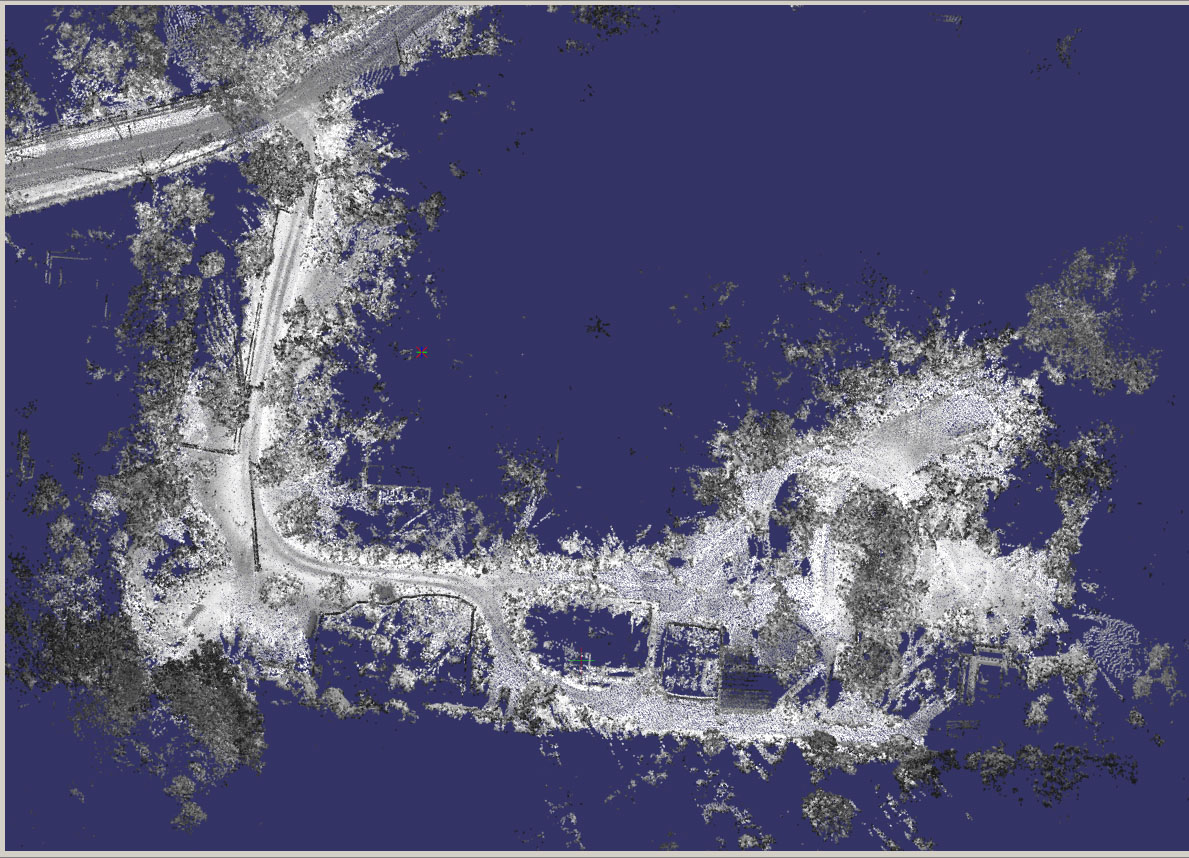
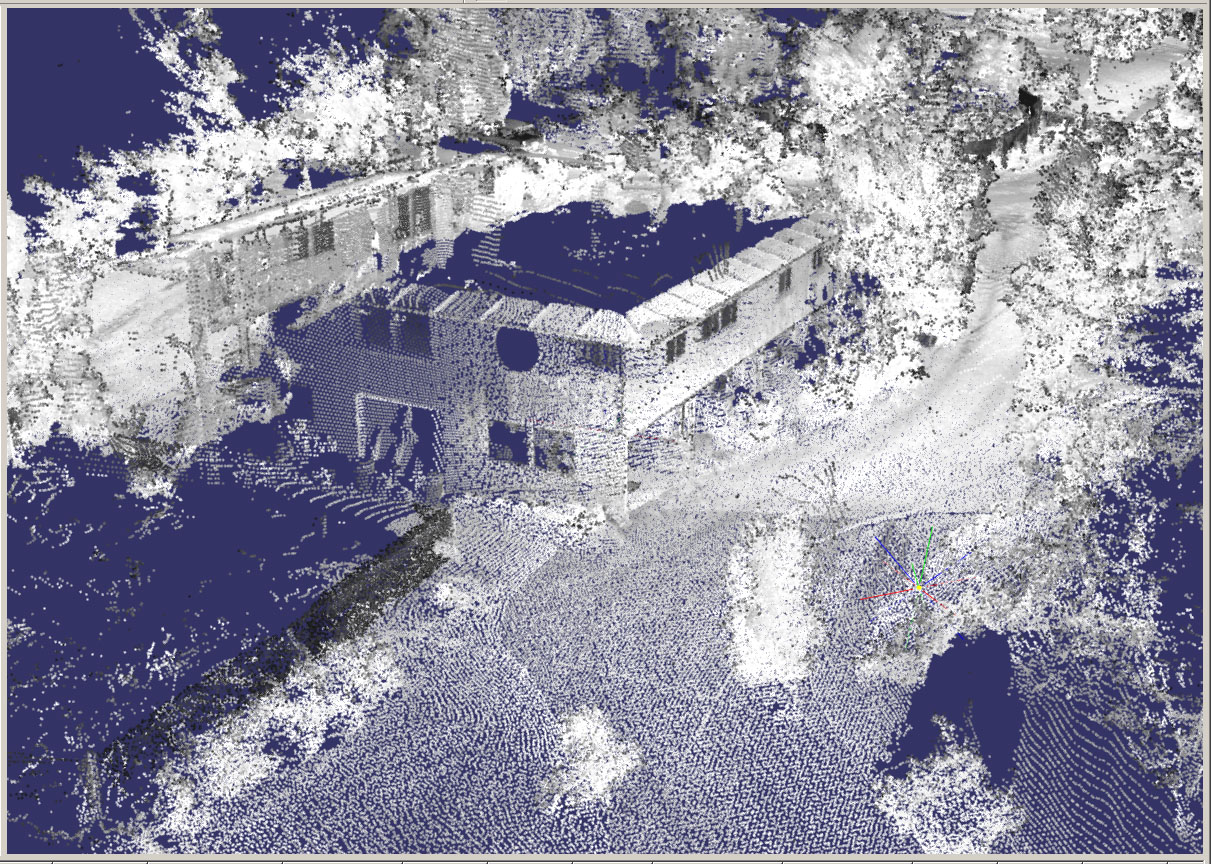
(The colors are not meaningful.) Notice how the surface is actually better in some places farther from the laser; that is because it was likely swept once by a single laser, rather than multiple times along the path which causes ambiguity where there are two "ground" clouds as much as a meter apart vertically.
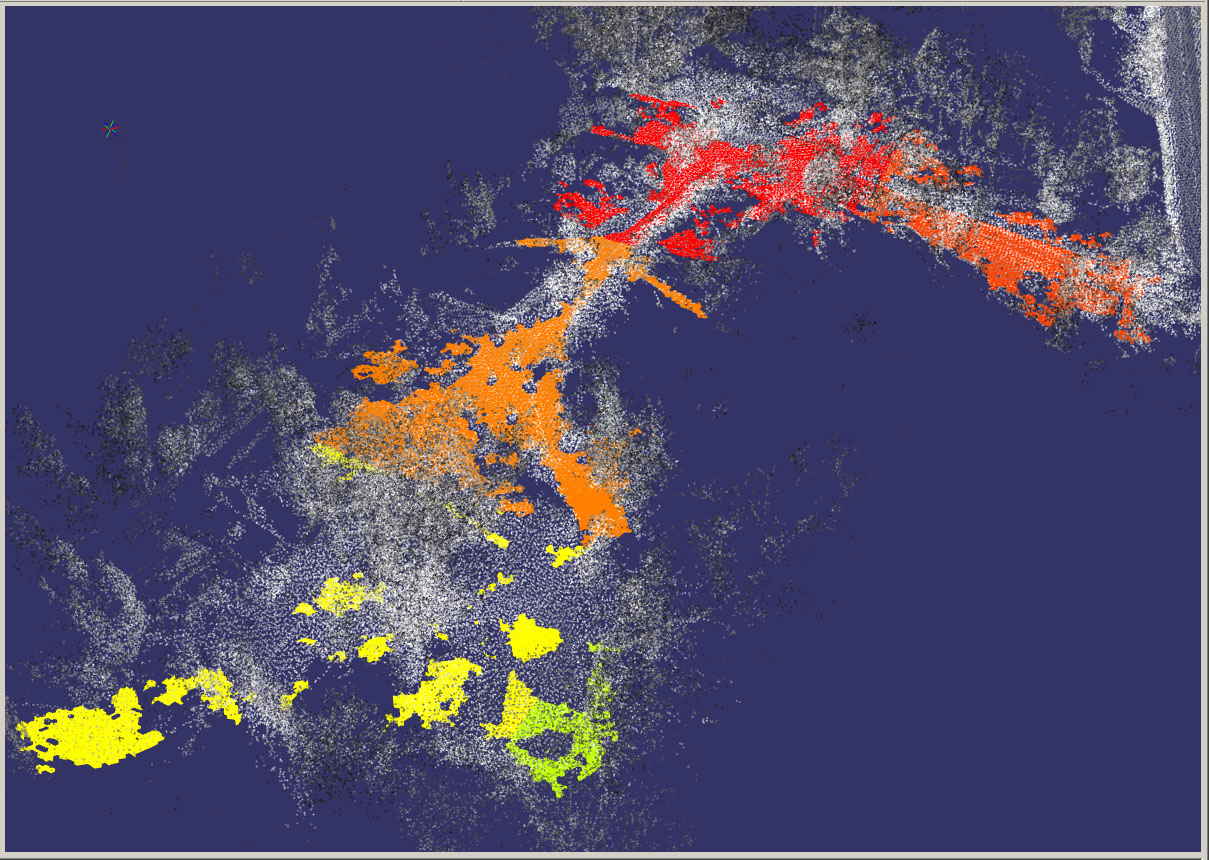
The TIN data, in VTP ITF format, 1.2MB in size: 2011-02-09-18-02-12.itf is in WGS84 UTM Zone 5, with ellipsoidal heights (easy to use with geocentric clouds); 2011-02-09-18-02-12_om.itf is the same with orthometric heights (easy to use with regular geodata). This is just a proof of concept, it is too sparse and erratic to be useful. Next steps would be to either do much better ground classification and handling of fuzzy multi-pass areas, or taking another approach such as hand-picking just a few trusted points and making a sparser TIN.
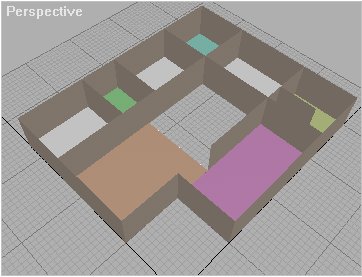
 The
architect, Gordon Motta, gave me a copy
of the blueprints for the main house. There are a several plan and elevation views,
and even detailed materials lists. However, I've learned it takes years of knowledge
of architecture and construction in general to make sense of a blueprint - not all
the 3D positioning and placement info is there, mostly it is left assumed.
The
architect, Gordon Motta, gave me a copy
of the blueprints for the main house. There are a several plan and elevation views,
and even detailed materials lists. However, I've learned it takes years of knowledge
of architecture and construction in general to make sense of a blueprint - not all
the 3D positioning and placement info is there, mostly it is left assumed.
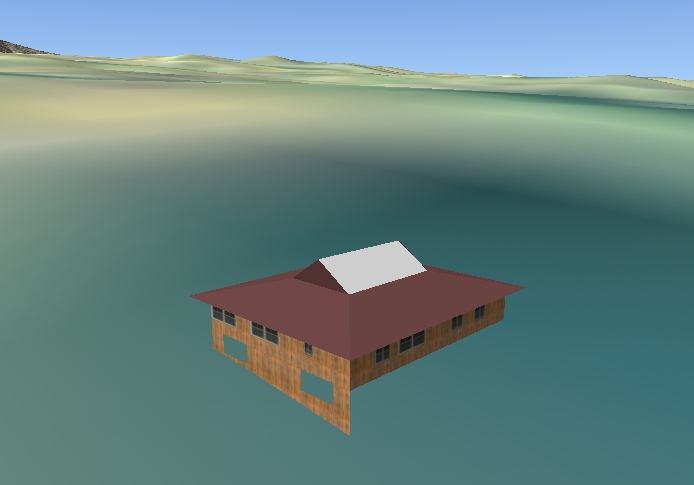 it
would build the house, completely describing the structural elements like
bricks and boards, and output the result into a realtime rendering environment
it
would build the house, completely describing the structural elements like
bricks and boards, and output the result into a realtime rendering environment